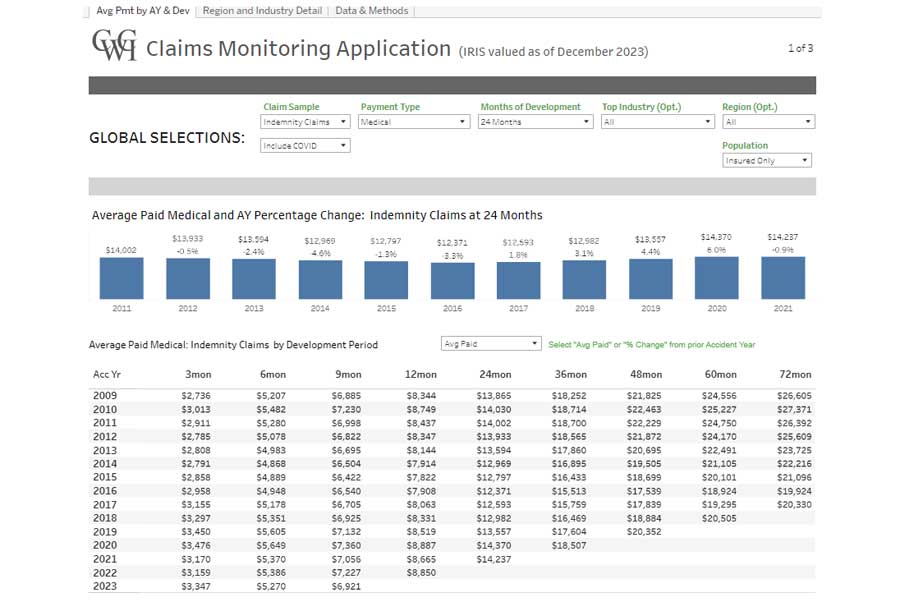
An interactive application that shows average paid indemnity and medical losses on claims from AY 2011 through AY December 2023 at nine levels of development (with payments valued through December 2023). The tool provides results for indemnity claims or for all claims, allows data to be viewed for specific industries and regions, and segments the medical payment data into medical treatment, pharmacy, medical-legal services, medical cost containment and other medical.
Interactive Research Tools
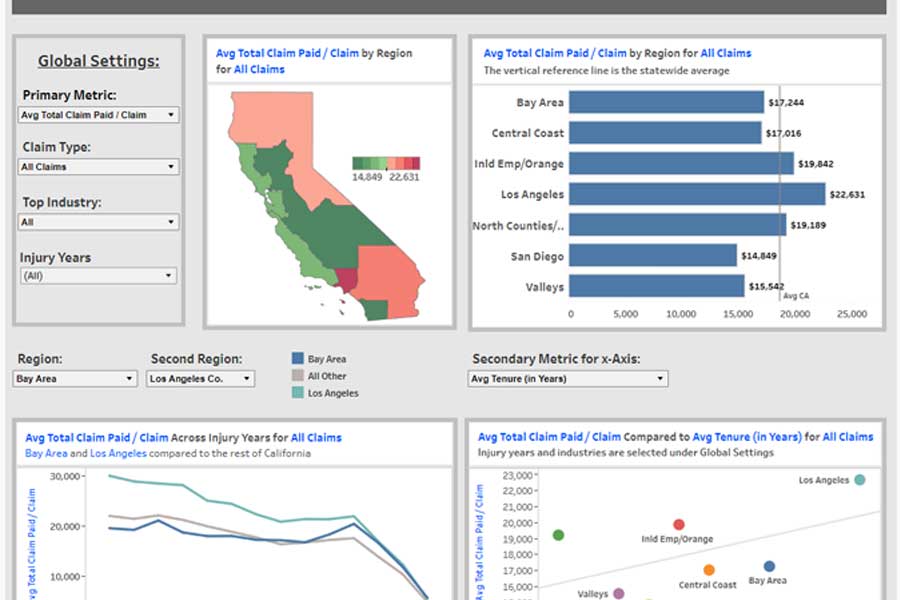
IRIS Regional Scorecard Interactive Tool
An interactive application based on updated IRIS data on AY 2010 through December 2023 claims from 7 different regions of the state that can be used to compare regional results to statewide data on key metrics, compare results between specific regions, and identify regional and statewide trends that have developed.
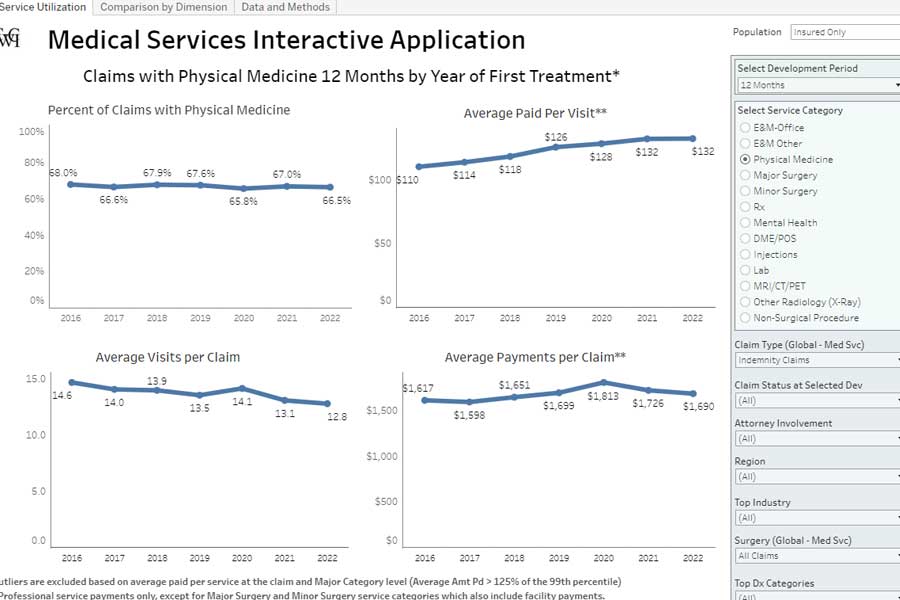
Medical Services Interactive Tool
In September of 2020, CWCI published the report “Changes in Medical Treatment Trends After 20 years of Incremental Workers’ Compensation Reform” that traced the use and cost of professional medical services over time. CWCI continues to monitor those trends and the purpose of this interactive application is to allow members to take a detailed view across key claim characteristics.

Prescription Drug Interactive Tool
An online application that can be used to examine and compare industrywide prescription drug data derived from prescriptions dispensed to injured workers between January 2016 and December 2023. This tool can be used to view statewide or regional prescription drug data either for all claims or for just indemnity claims, for open and/or closed claims; for specific drug groups; by opioid drug name; for generic and/or brand drugs; for specific industries; and for specific accident years or service years.
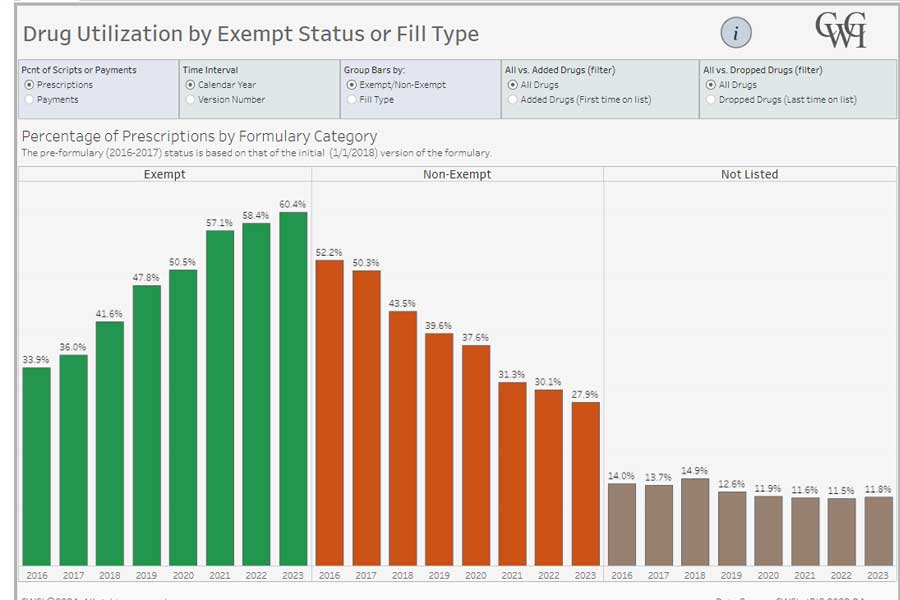
MTUS Formulary Interactive Data Tool
An online application that shows the breakdown of medications within each version of the MTUS Prescription Drug Formulary by formulary category: Exempt, Non-Exempt, Not Listed; Special Fill, and Perioperative drugs. Users can identify which drugs were added to or dropped from the formulary and when; easily find where approximately 100 therapeutic drug groups and hundreds of specific drugs have been categorized; track changes in prescription and payment distributions among the formulary categories beginning with pre-formulary years (CY 2016 and 2017) and extending into the post-formulary years beginning with CY 2018; find the average wholesale price (AWP) and the average amount paid for specific drugs (by drug ingredient) over time; and view lists of the top 20 drugs by formulary category, broken out either by calendar year or by formulary version.
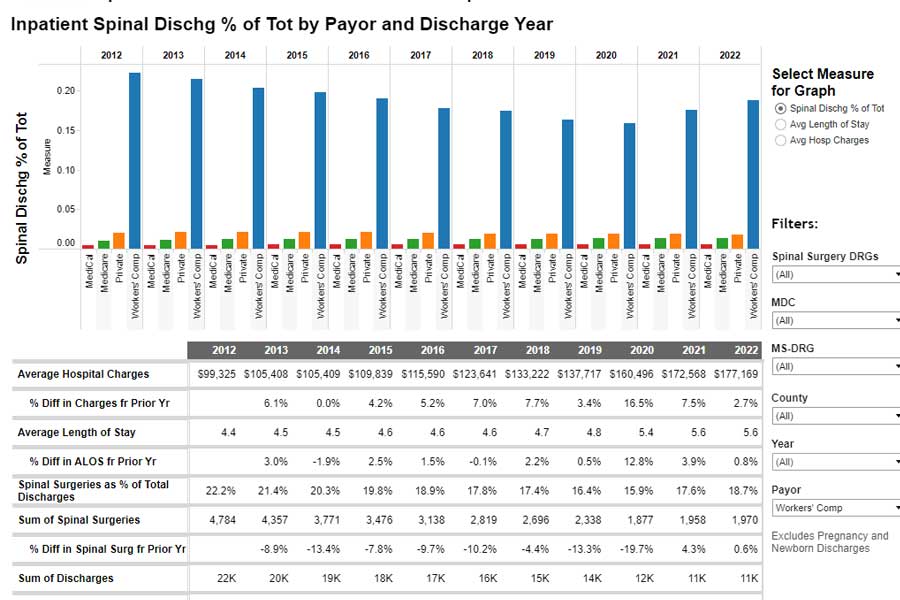
Inpatient Hospitalization Claim Interactive Tool
An interactive tool that offers detailed data on utilization trends, costs, and characteristics of Inpatient Hospitalization claims in California workers’ compensation, including comparative data on back surgery rates, average lengths of stay, and hospital charges for spinal fusions paid under Medicare, Medi-Cal and private coverage, regional variations, and hospital-specific data for 2012-2022 spinal fusion discharges.