A CWCI Legislative Impact Report examines SB 632, a bill that would give acute care hospital workers who provide direct patient care presumptions of compensability for 9 categories of injuries, encompassing more than 250 ICD-10 codes.
A CWCI Legislative Impact Report examines SB 632, a bill that would give acute care hospital workers who provide direct patient care presumptions of compensability for 9 categories of injuries, encompassing more than 250 ICD-10 codes.
CWCI’s analysis examines the various characteristics of Long COVID claims in California workers’ compensation, including the distribution of claims by diagnostic category and affected body part, the mix of treatment payments among medical service categories at different points of development, and demographic differences between Long COVID and shorter duration COVID claims. The Research Note is posted under the Research tab and is available to CWCI members and subscribers who log in. Others can purchase a copy from the Store.
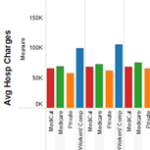
A CWCI Interactive Research Report based on the latest update to the Institute’s Inpatient Hospital Utilization Application which now includes inpatient hospital discharge data for CY 2012 through CY 2023 compiled by the California Department of Health Care Access and Information (HCAI). The report provides a refresher on how the application is formatted and can be used, and highlights some of the latest results and trends, including data that can be used to track and compare changes in the volume of inpatient hospitalizations paid under California workers’ compensation, Medicare, Medi-Cal, and private coverage since 2012.
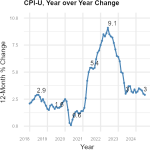
A new CWCI Report to the Industry explores how medical inflation impacts allowable fees under the California Official Medical Fee Schedule (OMFS).
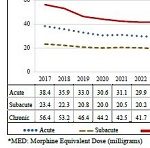
A CWCI Report to the Industry analyzes 2017-2023 opioid prescription data extracted from the California Department of Justices Controlled Substance Utilization Review and Evaluation System (CURES) database to track opioid utilization in the state, noting the percentage change in the number of opioid patients overall and within the workers compensation system from 2017 through 2023. The report measures changes in the average strength of the daily dose of morphine equivalents (the morphine equivalent dose or MED) and the average duration of opioid use for workers comp opioid patients and compares the results to the treatment guideline recommended levels to identify the proportion of patients whose opioid use exceeded guideline recommendations and how these proportions changed over time.
Are Migraine Drugs Becoming a New WC Rx Cost Driver? A new CWCI study looks at recent increases in the utilization and reimbursement of Migraine Drugs in California workers’ compensation and highlights 6 high-cost brand drugs that have helped fuel that growth.
A report highlighting recent results and trends from the latest update to CWCI’s Claims Monitoring Interactive Application which features AY 2009 – AY 2023 data (valued as of December 2023) on average medical payments, average paid indemnity, and combined medical and indemnity payments at nine levels of development ranging from 3 months to 72 months post injury. The report also provides a refresher on how the Application is formatted and how CWCI members can use it.

CWCI’s updated analysis of the impact of the new Med-Legal Fee Schedule based on data through October 2023.
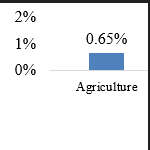
A CWCI Legislative Impact Report examines the issues surrounding SB 1299, a bill that would give farmworker heat-related injury claims a presumption of compensability if the employer is found non-compliant with Cal/OSHA’s outdoor heat standard.
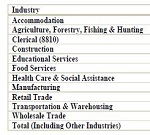
CT & Litigated Claims in California Workers’ Comp. A CWCI Research Note based on 1.4 million claims with claims administrator notification dates ranging from 2010 through 2022 tracks the growth of CT claims in California workers’ compensation and examines the impact that factors such as region, tenure, industry, age, and average weekly wage have on the likelihood of CT claims.