Oakland – New CWCI research that tracks average California workers’ comp medical loss, indemnity benefit and medical cost containment (MCC) payments on accident year (AY) 2005 through 2014 lost-time claims valued through June 2015 show mixed results, with more developed data on older claims showing paid medical losses and indemnity leveling out or declining, and less developed data on newer claims indicating that average amounts paid in the early stages of a claim are on the rise.
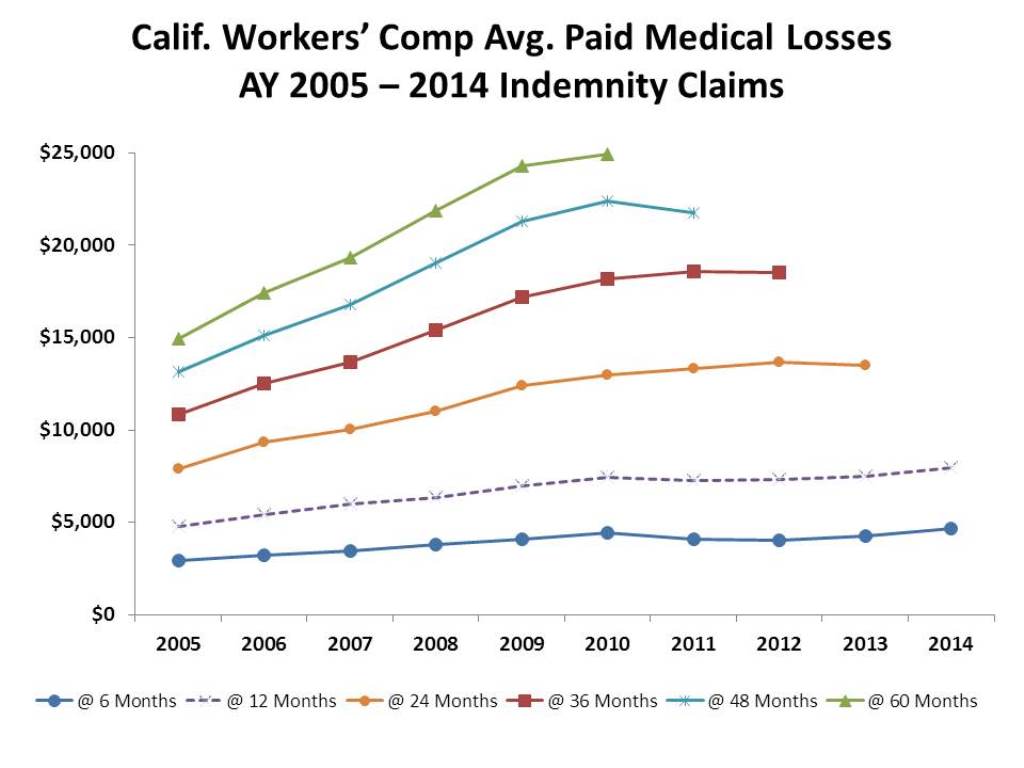
Using data from 1.8 million lost-time claims for work injuries that occurred during the 10-year span ending in December 2014, the study’s authors calculated the average amounts paid per claim for medical services and indemnity benefits at 6, 12, 24, 36, 48 and 60 months post injury, with results broken out by accident year. Prior studies found that after a brief post-reform decline in AY 2005, average medical loss payments, which include payments for medical treatment, drugs and durable medical equipment (DME), and medical-legal services, but not medical cost containment, began a steady uptrend starting in AY 2006. The updated figures show similar results, but recent growth patterns for paid medical losses varied depending on when the payments were valued. For example, first-year medical losses increased steadily from AY 2005 through AY 2010, declined briefly in AY 2011 then began to trend up again, edging up 0.8 percent in AY 2012, before increasing 2.8 percent in 2013 and 6.2 percent in 2014. In contrast, more mature data on older claims showed steady growth until recently, but the latest results indicate slight reductions in paid medical losses at 24, 36 and 48 months post injury, the first declines in several years. The most developed data in the study tracks average amounts paid at 60 months post injury, so data on claims from AY 2010 is the most recent available, and these results show the average medical loss per claim at five years of development rose 2.7 percent in AY 2010 compared to AY 2009, though that was significantly less than the double-digit increases noted in each of the four prior years. Paid medical loss trends at all six levels of development for claims from AY 2005 through the most recent year for which data are available are noted in the chart.

In addition to tracking paid medical losses over the past decade, the study measures changes in average payments for medical treatment (physician and non-physician fees, lab and pathology charges, hospitals and ambulatory surgery center fees, transportation, etc.); drugs and DME; med-legal services; MCC (which is a loss adjustment expense), and indemnity benefits, which include temporary disability, permanent disability, supplemental job displacement benefits, life pensions and death benefits. As with the medical loss results, average payments for each category were calculated at six levels of development for indemnity claims from AY 2005 through AY 2014. Tables with results for all claims, including medical-only cases, are included as appendices to the report.
CWCI has published its study in a Research Update report, “California Workers’ Compensation Claims Monitoring: Medical & Indemnity Development, AY 2005 – AY 2014.” The public can access the report at www.cwci.org/research. CWCI members and subscribers may also log in to www.cwci.org/my-account/ to obtain a summary Bulletin.
