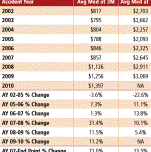
A new CWCI Research Update reveals that average medical expenditures on California work injury claims continue to climb, with medical treatment, prescription/durable medical equipment (DME), medical management/cost containment and med-legal payments all trending up.
Research Reports
Prescribing Patterns for Schedule II Opioids in Calif. WC.
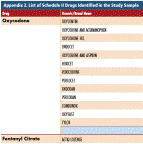
A new CWCI study on prescribing patterns for Schedule II Opioids in California workers’ compensation finds that a relatively small percentage of medical providers account for the vast majority of these narcotic prescriptions and the associated payments, and that more than half of the prescriptions are for minor back injury claims.
Public Self-Insured Claims Experience in California WC FY 1999 – 2010
California public self-insured losses continued to mount last year, despite declining claim volume, as claim severity (average loss per claim) increased for the fourth year in a row.
Percentage of Calif. WC Prescriptions Falling Outside the Medi-Cal Fee Schedule Database
A CWCI study finds that most injured worker prescriptions in California are in the Medi-Cal fee schedule database that sets maximum reasonable pharmacy fees and helps control workers’ comp costs, suggesting that other factors such as an increase in the number of scripts/claim, increases in Average Wholesale Prices used to calculate pharmacy fees, a shift toward more expensive drugs, and PBM contract rates and payments that exceed fee schedule allowances, may be responsible for recent growth in prescription drug costs.
The Cost and Utilization of Compound Drugs, Convenience Packs and Medical Foods in California WC
A new CWCI study on Calif. workers’ comp prescriptions shows the use of compound drugs, medical foods, and “co-packs” that combine prescription drugs and medical foods, increased sharply in the 2nd quarter of 2007 – coinciding with state regulators’ crackdown on physician-dispensed repackaged drugs.
Temporary Disability Outcomes in California Workers’ Compensation, AY 2002-2008
A new CWCI study, based on claims from AY 2002 through March 2008, provides updated data on average temporary disability payments and paid TD days measured at 12 and 24 months following the initial TD payment.
Medical Development Trends in Calif WC, AY 2002-09
A new CWCI analysis, based on claims experience from AY 2002 through June 2009, takes an updated look at the development of California workers’ comp paid medical costs.
MPN Utilization in California Workers’ Compensation
New CWCI Research finds that the use of network providers to deliver medical services to injured workers, which rose sharply following the introduction of MPNs, has continued, albeit at a slower pace, as has the growth in the percentage of medical dollars flowing to network providers.
Surgical Instrumentation Pass-through Payments in the California WC System
A new CWCI study shows the duplicate spinal implant pass-through payments allowed for hardware and instrumentation in California workers’ comp back surgeries were paid on nearly 3,600 claims in 2008, boosting payments to hospitals by an estimated $55 million.
ICIS Industry Score Card: Long-Term Care
A new CWCI “Industry Score Card” shows that most job injury claims filed by California nursing home and long-term care workers are simple medicalonly claims that result in no lost time, and about half of all claims in the sector involve strains and sprains, most of which close within a year.
ICIS Industry Score Card: Trucking Industry
A new CWCI Industry Score Card finds that a high percentage of job injury claims in California’s trucking industry result in lost time, and given the high volume of relatively serious injuries in this sector, the average medical and indemnity payments on trucking industry claims are well above the average for all claims in the state.
ICIS Industry Score Card: Restaurant Industry Claims Experience
In the midst of the ongoing shift in the California job market and the recent weakness in the state’s economy, job injury claims by restaurant workers rose from less than 5% of all California workers’ compensation claims in 2001 to 8% of the claims in 2008, while claim payments to restaurant workers jumped from 3.2% to 5.6% of paid losses. CWCI’s latest Industry Score Card takes an indepth look at workers’ comp claims filed by restaurant workers between AY 2000 and AY 2008.
ICIS Industry Score Card: Non-Durable Goods Manufacturing
CWCI’s latest “Industry Score Card” provides detailed data on AY 2000 to 2008 claims experience among nondurable goods manufacturing workers in California. The new Score Card is based on a review of 136,742 job injury claims filed by workers involved in the manufacture of “soft goods” that are typically used or need to be replaced within a relatively short period – for example food items, apparel, and plastic goods.
Public Self-Insured Claims Experience in California WC FY 1999 – 2009
A CWCI analysis of claims data from California public self-insured employers finds that paid and incurred losses on those claims peaked in FY 02/03, then declined sharply, albeit briefly, following the ’02-04 reforms.
ICIS Industry Score Card: Durable Goods Manufacturing Claims Experience
Claims by durable goods manufacturing workers declined from 1 in 9 California job injuries in 2001 to less than 1 in 14 claims in 2008, underscoring the steep decline in manufacturing in the state, but average claim costs in this sector have jumped sharply since 2005, with both medical and indemnity benefit payments on the rise.
ICIS Industry Score Card: Agriculture
This Score Card focuses on California workers’ compensation claims filed by Agriculture workers. It is the fourth in a series of analyses that provide data from CWCI’s Industry Claims Information System (ICIS) database on claims experience within specific industry categories.
ICIS Industry Scorecard: Mercantile Claims Experience
Mercantile workers represented 1 out of 8 California job injury claims and a similar proportion of paid losses during the 8-year period spanning accident years (AY) 2001 through 2008. Comparing results by individual accident year, however, shows mercantile claims as a percentage of all claims fell steadily across this period.
ICIS Industry Score Card: Professional/Clerical Claims Experience
CWCI’s second ICIS Industry Score Card profiles workers’ compensation claims experience for professional and clerical workers in California. Based on a sample of 361,384 claims for injuries occurring between 2000 and 2008.
ICIS Industry Score Card: Construction Claims Experience
The first Score Card in the series focuses on construction industry claims from accident years 2000 to 2008.
Post-Reform Outcomes: Permanent Disability Claims with Attorney Involvement Preliminary Analysis & Findings
CWCI analyzed 201,081 permanent disability (PD) claims to assess statewide and regional changes in attorney involvement, initial PD benefit payment, claim closure rates and average claim payments following the implementation of SB 899 in April 2004.


